
Income elasticity of demand is the degree of responsiveness of quantity demanded of a commodity due to change in consumer’s income, other things remaining constant. In other words, it measures by how much the quantity demanded changes with respect ot the change in income.
The income elasticity of demand is defined as the percentage change in quantity demanded due to certain percent change in consumer’s income.
Expression of Income Elasticity of Demand
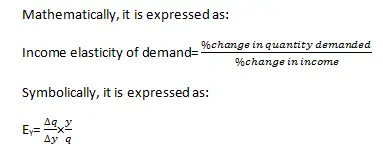
Where, EY = Elasticity of demand
q = Original quantity demanded
∆q = Change in quantity demanded
y = Original consumer’s income
∆y= Change in consumer’s income
Example to Explain Income Elasticity of Demand
Suppose that the initial income of a person is Rs.2000 and quantity demanded for the commodity by him is 20 units. When his income increases to Rs.3000, quantity demanded by him also increases to 40 units. Find out the income elasticity of demand.
Solution:
Here, q = 100 units
∆q = (40-20) units = 20 units
y = Rs.2000
∆y =Rs. (3000-2000) =Rs.1000
Now,

Hence, an increase of Rs.1000 in income i.e. 1% in income leads to a rise of 2% in quantity demanded.
Types of Income Elasticity of demand
1. Positive income elasticity of demand (EY>0)
If there is direct relationship between income of the consumer and demand for the commodity, then income elasticity will be positive. That is, if the quantity demanded for a commodity increases with the rise in income of the consumer and vice versa, it is said to be positive income elasticity of demand. For example: as the income of consumer increases, they consume more of superior (luxurious) goods. On the contrary, as the income of consumer decreases, they consume less of luxurious goods.
Positive income elasticity can be further classified into three types:
-
Income elasticity greater than unity (EY > 1)
If the percentage change in quantity demanded for a commodity is greater than percentage change in income of the consumer, it is said to be income greater than unity. For example: When the consumer’s income rises by 3% and the demand rises by 7%, it is the case of income elasticity greater than unity.

In the given figure, quantity demanded and consumer’s income is measured along X-axis and Y-axis respectively. The small rise in income from OY to OY1 has caused greater rise in the quantity demanded from OQ to OQ1 and vice versa. Thus, the demand curve DD shows income elasticity greater than unity.
-
Income elasticity equal to unity (EY = 1)
If the percentage change in quantity demanded for a commodity is equal to percentage change in income of the consumer, it is said to be income elasticity equal to unity. For example: When the consumer’s income rises by 5% and the demand rises by 5%, it is the case of income elasticity equal to unity.

In the given figure, quantity demanded and consumer’s income is measured along X-axis and Y-axis respectively. The small rise in income from OY to OY1 has caused equal rise in the quantity demanded from OQ to OQ1 and vice versa. Thus, the demand curve DD shows income elasticity equal to unity.
-
Income elasticity less than unity (EY < 1)
If the percentage change in quantity demanded for a commodity is less than percentage change in income of the consumer, it is said to be income greater than unity. For example: When the consumer’s income rises by 5% and the demand rises by 3%, it is the case of income elasticity less than unity.

In the given figure, quantity demanded and consumer’s income is measured along X-axis and Y-axis respectively. The greater rise in income from OY to OY1 has caused small rise in the quantity demanded from OQ to OQ1 and vice versa. Thus, the demand curve DD shows income elasticity less than unity.
2. Negative income elasticity of demand ( EY<0)
If there is inverse relationship between income of the consumer and demand for the commodity, then income elasticity will be negative. That is, if the quantity demanded for a commodity decreases with the rise in income of the consumer and vice versa, it is said to be negative income elasticity of demand. For example:
As the income of consumer increases, they either stop or consume less of inferior goods.

In the given figure, quantity demanded and consumer’s income is measured along X-axis and Y-axis respectively. When the consumer’s income rises from OY to OY1 the quantity demanded of inferior goods falls from OQ to OQ1 and vice versa. Thus, the demand curve DD shows negative income elasticity of demand.
3. Zero income elasticity of demand ( EY=0)
If the quantity demanded for a commodity remains constant with any rise or fall in income of the consumer and, it is said to be zero income elasticity of demand. For example: In case of basic necessary goods such as salt, kerosene, electricity, etc. there is zero income elasticity of demand.

In the given figure, quantity demanded and consumer’s income is measured along X-axis and Y-axis respectively. The consumer’s income may fall to OY1 or rise to OY2 from OY, the quantity demanded remains the same at OQ. Thus, the demand curve DD, which is vertical straight line parallel to Y-axis shows zero income elasticity of demand.
[Related Reading: Use of Income Elasticity of Demand in Business Decision Making]