
In microeconomics, indifference curve is an important tool of analysis in the study of consumer behavior.
The concept of indifference curve analysis was first propounded by British economist Francis Ysidro Edgeworth and was put into use by Italian economist Vilfredo Pareto during the early 20th century. However, it was brought into extensive use by economists J.R. Hicks and R.G.D Allen.
Hicks and Allen criticized Marshallian cardinal approach of utility and developed indifference curve theory of consumer’s demand. Thus, this theory is also known as ordinal approach.
Indifference curve
An indifference curve is a locus of all combinations of two goods which yield the same level of satisfaction (utility) to the consumers.
Since any combination of the two goods on an indifference curve gives equal level of satisfaction, the consumer is indifferent to any combination he consumes. Thus, an indifference curve is also known as ‘equal satisfaction curve’ or ‘iso-utility curve’.
On a graph, an indifference curve is a link between the combinations of quantities which the consumer regards to yield equal utility. Simply, an indifference curve is a graphical representation of indifference schedule.
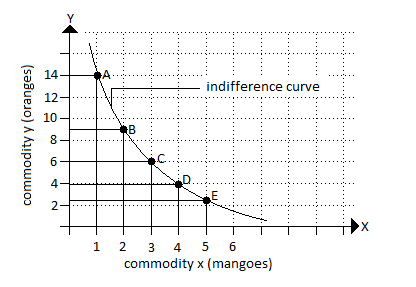
The table given below is an example of indifference schedule and the graph that follows is the illustration of that schedule.
| Table: Indifference schedule | ||
| Combination | Mangoes | Oranges |
| A | 1 | 14 |
| B | 2 | 9 |
| C | 3 | 6 |
| D | 4 | 4 |
| E | 5 | 2.5 |
Figure: Graphical representation of indifference curve
Assumptions of indifference curve
The indifference curve theory is based on few assumptions. These assumptions are
Two commodities
It is assumed that the consumer has fixed amount of money, all of which is to be spent only on two goods. It is also assumed that prices of both the commodities are constant.
Non satiety
Satiety means saturation. And, indifference curve theory assumes that the consumer has not reached the point of satiety. It implies that the consumer still has the willingness to consume more of both the goods. The consumer always tends to move to a higher indifference curve seeking for higher satisfaction.
Ordinal utility
According to this theory, utility is a psychological phenomenon and thus it is unquantifiable. However, the theory assumes that a consumer can express utility in terms of rank. Consumer can rank his/her preferences on the basis of satisfaction yielded from each combination of goods.
Diminishing marginal rate of substitution
Marginal rate of substitution may be defined as the amount of a commodity that a consumer is willing to trade off for another commodity, as long as the second commodity provides same level of utility as the first one.
And, diminishing marginal rate of substitution states that the rate by which a person substitutes X for Y diminishes more and more with each successive substitution of X for Y.
As indifference curve theory is based on the concept of diminishing marginal rate of substitution, an indifference curve is convex to the origin.
Rational consumers
According to this theory, a consumer always behaves in a rational manner, i.e. a consumer always aims to maximize his total satisfaction or total utility.
Properties of indifference curve
There are four basic properties of an indifference curve. These properties are
Indifference curve slope downwards to right
An indifference curve can neither be horizontal line nor an upward sloping curve. This is an important feature of an indifference curve.
When a consumer wants to have more of a commodity, he/she will have to give up some of the other commodity, given that the consumer remains on the same level of utility at constant income. As a result, the indifference curve slopes downward from left to right.
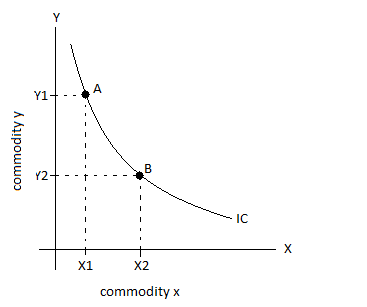
In the above diagram, IC is an indifference curve, and A and B are two points which represent combination of goods yielding same level of satisfaction.
We can see that when X1 amount of commodity X was consumed, Y1 amount of commodity Y was also consumed. When the consumer increased the consumption of commodity X to X2, the amount of commodity Y fell to Y2. And, thus the curve is sloping downward from left to right.
Indifference curve is convex to the origin
As mentioned previously, the concept of indifference curve is based on the properties of diminishing marginal rate of substitution.
According to diminishing marginal rate of substitution, the rate of substitution of commodity X for Y decreases more and more with each successive substitution of X for Y.
Also, two goods can never perfectly substitute each other. Therefore, the rate of decrease in a commodity cannot be equal to the rate of increase in another commodity.
| Table: Indifference schedule | ||
| Combination | Cigarette | Coffee |
| A | 1 | 12 |
| B | 2 | 8 |
| C | 3 | 5 |
| D | 4 | 3 |
| E | 5 | 2 |
The above table represents various combination of coffee and cigarette that gives a man same level of utility. When the man drinks 12 cup of coffee, he consumes 1 cigarette every day. When he started consuming two cigarettes a day, his coffee consumption dropped to 8 cups a day. In the same way, we can see other combinations as 3 cigarettes + 5 cup coffee, 4 cigarettes + 3 cup coffee and 5 cigarettes + 2 cup coffee.
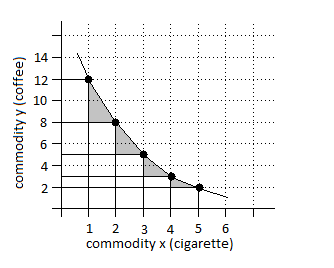
We can clearly see that the rate of decrease in consumption of coffee is not the same as rate of increase in consumption of cigarette. Similarly, rate of decrease in consumption of coffee has gradually decreased even with constant increase in consumption of cigarette.
Thus, indifference curve is always convex (neither concave nor straight).
Indifference curve cannot intersect each other
Each indifference curve is a representation of particular level of satisfaction.
The level of satisfaction of consumer for any given combination of two commodities is same for a consumer throughout the curve. Thus, indifference curves cannot intersect each other.
The following diagram will help you understand this property clearer.
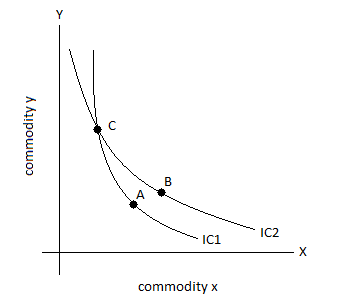
In the above image, IC1 and IC2 are two indifference curves and C is the point where both the curves intersect.
According to indifference curve theory, satisfaction at point C = satisfaction at point A
Also, satisfaction at point C = satisfaction at point B
But, satisfaction at point B ≠ satisfaction at point A.
Therefore, two indifference curves cannot intersect. Yet, two indifference curves need not be parallel to each other.
Higher indifference curve represents higher level of satisfaction
Higher the indifference curves, higher will be the level of satisfaction. This means, any combination of two goods on the higher curve give higher level of satisfaction to the consumer than the combination of goods on the lower curve.
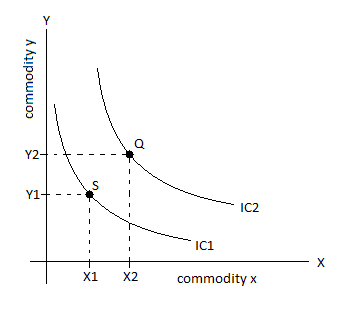
In the above figure, IC1 and IC2 are two indifference curves, and IC2 is higher than IC1. We can also see that Q is a point on IC2 and S is a point on IC2.
Combination at point Q contains more of both the goods (X and Y) than that of the combination at point S. We know that total utility of commodity tends to increase with increase in stock of the commodity. Thus, utility at point Q is greater than utility at point S, i.e. satisfaction yielded from higher curve is greater than satisfaction yielded from lower curve.