
What is a supply curve?
A supply curve is a graphical representation of the relationship between the amount of a commodity that a producer or supplier is willing to offer and the price of the commodity, at any given time. In other words, a supply curve can also be defined as the graphical representation of a supply schedule.
In a graph, the price of the commodity is shown on the vertical axis (Y-axis) and the quantity supplied is shown on the horizontal axis (X-axis) of the graph. It is an upward slope, which means higher the price, higher will be the quantity supplied, and lower the price, lesser will be the quantity supplied.
Given below are two figures –I and II. Figure I is an example of supply schedule and figure II is its graphical illustration.
| Fig. I: Individual supply schedule | |
| Price of milk per liter (in Rs.) | Quantity supplied per day in liters (*1000) |
| 10 | 10 |
| 20 | 20 |
| 30 | 30 |
| 40 | 40 |
Fig. II: Supply curve

Movement along a supply curve
The amount of commodity supplied changes with rise and fall of the price while other determinants of supply remain constant. This change, when shown in the graph, is known as movement along a supply curve.
In simple words, movement along a supply curve represents the variation in quantity supplied of the commodity with a change in its price and other factors remaining unchanged.
The movement in supply curve can be of two types – extension and contraction. Extension in a supply curve is caused when there is an increase in the price or quantity supplied of the commodity while contraction is caused due to a decrease in the price or quantity supplied of the commodity.
In the above fig. II, let us suppose Rs. 20 is the original price of milk per liter and 20,000 liters is the original quantity of supply. When the price rises from Rs. 20 to Rs. 30, the amount of quantity supplied rises from 20,000 liters to 30,000 liters, and there is a movement in the supply curve from point B to point C. This movement is known as an extension of the supply curve.
Similarly, when the price falls from Rs. 20 to Rs. 10, the amount of quantity supplied falls from 20,000 liters to 10,000 liters, and there is another movement in the supply curve from point B to point A. This movement is known as a contraction of the supply curve.
Shift in supply curve
The amount of commodity that the producers or suppliers are willing to offer at the marketplace can change even in cases when factors other than the price of the commodity change. Such non-price factors can be the cost of factors of production, tax rate, state of technology, natural factors, etc.
When the quantity of the commodity supplied changes due to change in non-price factors, the supply curve does not extend or contract but shifts entirely. For an instance, the introduction of improved technology in industries helps in reducing the cost of production and induces production of more units of a commodity at the same price. As a result, the quantity of commodity supplied increases but the price of the commodity remains as it is.
Fig. III: Shift in supply curve
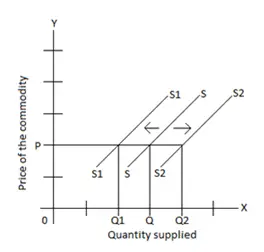
The shift in supply curve can also be of two types – rightward shift and leftward shift. The rightward shift occurs in supply curve when the quantity of supplied commodity increases at same price due to favorable changes in non-price factors of production of the commodity. Similarly, a leftward shift occurs when the quantity of supplied commodity decreases at the same price.
In the above fig. III, let us suppose that SS is the original supply curve where Q amount of commodity has been supplied at price P. Due to favorable changes in non-price factors, the production of the commodity has increased and its supply has been increased by Q2 – Q amount, at the same price. This has caused the supply curve rightwards and new supply curve S2S2 has formed.
In the same, due to unfavorable changes in non-price factors of the commodity, the production and supply have fallen to Q1 amount. Accordingly, the supply curve has shifted leftwards and new supply curve S1S1 has formed.
Reasons for rightward shift of supply curve
- Improvement in technology
- Decrease in tax
- Decrease in cost of factor of production
- Favorable weather condition
- Seller’s expectation of fall in price in future
Reasons for leftward shift of supply curve
- Use of old or outdated technology
- Increase in tax
- Increase in cost of factor of production
- Unfavorable weather condition
- Seller’s expectation of rise in price in future